Dear Unitholders,
The Pender Alternative Absolute Return Fund returned -0.6% in April, bringing year to date returns to 1.4%[1].
Wild swings in risk assets and market tone induced by US President Trump’s “Liberation Day” announcement created opportunities for the Fund to both add on weakness and sell into strength. The ICE BofA US High Yield Index returned 0.0% following a decline of as much as 2.6% early in the month. The recovery in credit was uneven; the breadth of the rebound was narrower than the decline as investors crowded into fewer positions that were perceived to be safe, at least for now.
The HFRI Credit Index, the Fund’s benchmark returned -0.6% in April bringing year to date returns to 0.9%.
Portfolio & Market Update
The Fund entered April with relatively defensive positioning. While initially raising cash on the first day of significant spread widening, the Fund started to add to market exposure on April 4, before peaking right before Trump’s pivot on April 9. As the market rallied over the last three weeks of April, the Fund sold into strength as valuations for higher quality credit appeared full to us.
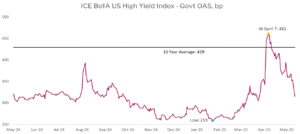
Source: Bloomberg/ICE
With spreads hitting 309bp on May 13, rallying 152bp from recent highs and well below the 10-year average we believe that generic credit spreads, along with risk assets broadly, are pricing in a very low probability of a US recession this year. It is remarkable to us that high yield spreads have rallied to within 8bp of the lowest value during the 2008-2023 period. Spreads are both a coincident indicator of financial conditions as well as a forward indicator of expected losses from defaults. With a negative Q1 GDP print in the US and headwinds for many cyclical businesses, we believe that the odds of a recession are significantly higher than market pricing indicates today.
When Churchill Downs Inc. (NYSE: CHDN) reported their Q1 earnings, they announced that they were suspending all future growth capital projects due to uncertainty related to construction costs and consumer demand. While there is clear and justified relief that the worst-case outcomes for tariffs have been avoided, the changes to trade policy and taxation are still quite significant. The impact of these changes will take time, especially in sectors that have been singled out, like autos and metals.
One area where the Fund experienced markdowns in April was in energy credits, as demand concerns were compounded by prospects for increased OPEC+ supply. We believe that all of our positions are well suited to withstand a cycle, but there is a risk that further markdowns occur in the near term before they ultimately converge towards par. We took sales in some energy positions where we believed risk for further repricing was higher, or where there was very little upside left due to call options embedded in the bond. We added an exposure to MEG Energy Corp.’s (TSX: MEG) bonds on weakness in April, before selling out of the position once it had rallied over three points above our purchase price in just two weeks.
Broadly syndicated term loans have been a core part of the Fund over the past couple of years, as we believed both that market pricing for rate cuts was often overly enthusiastic and that term loans provided attractive near-term carry for the Fund. Following multiple loan re-pricings (at lower spreads) last year, we now believe there is a significant risk of loans declining in price, driven by a spread widening event combined with the potential for rate cuts if economic data weakens materially. Because of this, we have taken our loan exposure from about 10% of the Fund at the end of March to about 2% of the Fund in the second week of May. Most of our loan exposures were in large capitalization, high quality capital structures and trading within one point of par, providing limited potential for capital gains but which we believe have a risk of multiple point mark downs in the coming quarters.
Market Outlook
With high yield spreads in the low 300s any additional spread compression will likely be a slow grind from here. Valuations are now once again at levels that leave the market especially vulnerable to negative shocks. While the market has concluded for now that the increased tariff regime under Trump will not cause significant economic pain, we believe more time is needed to see the impact of the changes, the terms of which are both material and constantly changing.
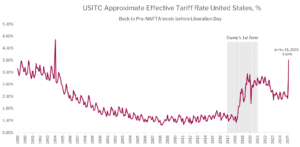
Source: Bloomberg/US Commerce Department
According to Bloomberg, as of May 13, post the dramatic roll back of China tariffs, the effective US tariff rate is now around 13%, dramatically higher than the effective rate on March 31 which was itself a spike from the status quo coming into 2025. This is effectively a tax paid by companies and consumers and a headwind for economic growth in 2025.
While equity markets are higher and credit spreads are tighter than they were before “Liberation Day”, the event itself could have lasting implications for both the economy and markets. Container shipments from China to the United States fell in April and will take weeks to recover, reducing sales and profits for affected industries. The US Treasury market saw a dramatic sell-off in mid-April, some of which was likely driven by foreign investors seeking to reduce their US exposure. With the US Treasury running large fiscal deficits, reduced demand for their issues from foreign buyers has the potential to impact risk premiums.
We suspect that the UK and China provisional deals represent both a floor and a ceiling for tariff rates on inbound goods to the US going forward. China achieved a better rate than the initial April 2 announcement while the UK did not. The better outcome for the country which fought back hard will likely encourage trading partners to hold firm in negotiations and use leverage where available.
The strong bounce in risk assets could continue in the coming weeks. But post the China deal, valuations appear elevated. Changing global trade dynamics could have unexpected consequences. There is potential for Treasury markets to create risk asset volatility sooner than later with the curve close to the point where markets have historically become concerned about funding costs.
Portfolio Metrics
The Fund finished April with long positions of 104.4% (excluding cash and T-bills). 27.9% of these positions are in our Current Income strategy, 76.4% in Relative Value and 0.0% in Event Driven positions. The Fund had a -56.7% short exposure that included -3.4% in government bonds, -38.5% in credit and -14.8% in equities. The Option Adjusted Duration was 1.23 years.
Excluding positions that trade at spreads of more than 500bp and positions that trade to call or maturity dates that are 2027 and earlier, Option Adjusted Duration declined to 0.37 years.
The Fund’s current yield was 5.38% while yield to maturity was 7.96%.
Justin Jacobsen, CFA
May 16, 2025
[1] All Pender performance data points are for Class F of the Fund unless otherwise stated. Other classes are available. Fees and performance may differ in those other classes. Standard Performance Information for the Fund may be found here: https://penderfund.com/solutions/